Photo credit: Tobias Luthe
Visual storytelling is at the heart of my design practice. I translate complex ideas into accessible visuals that support communication, shared understanding, and collective action. Grounded in systems thinking and strong graphic design fundamentals, I see visual communication as a sensemaking practice—linking perspectives, clarifying intentions, and helping people understand what they’re working on together. My work ranges from conceptual diagrams and maps to brand, marketing, and educational materials developed for the Transformations Community, COBALT, ETH Zurich’s Systemic Design Labs, The Oslo School for Architecture and Design and Renzo Piano Building Workshop.
Areas of experience include:
Complex data visualization (diagrams, system maps, infographics)
Visual didactics for educational materials and textbooks
Event-related materials (slide decks, signage, programs)
Promotional materials (flyers, posters, brochures)
Social media templates and content
Website and email campaign graphics
Wayfinding and environmental graphics
Visual Storytelling

Visual booklet showcasing diverse stories and interpretations of resilience across international mountain communities.
Marketing & Promotional Materials
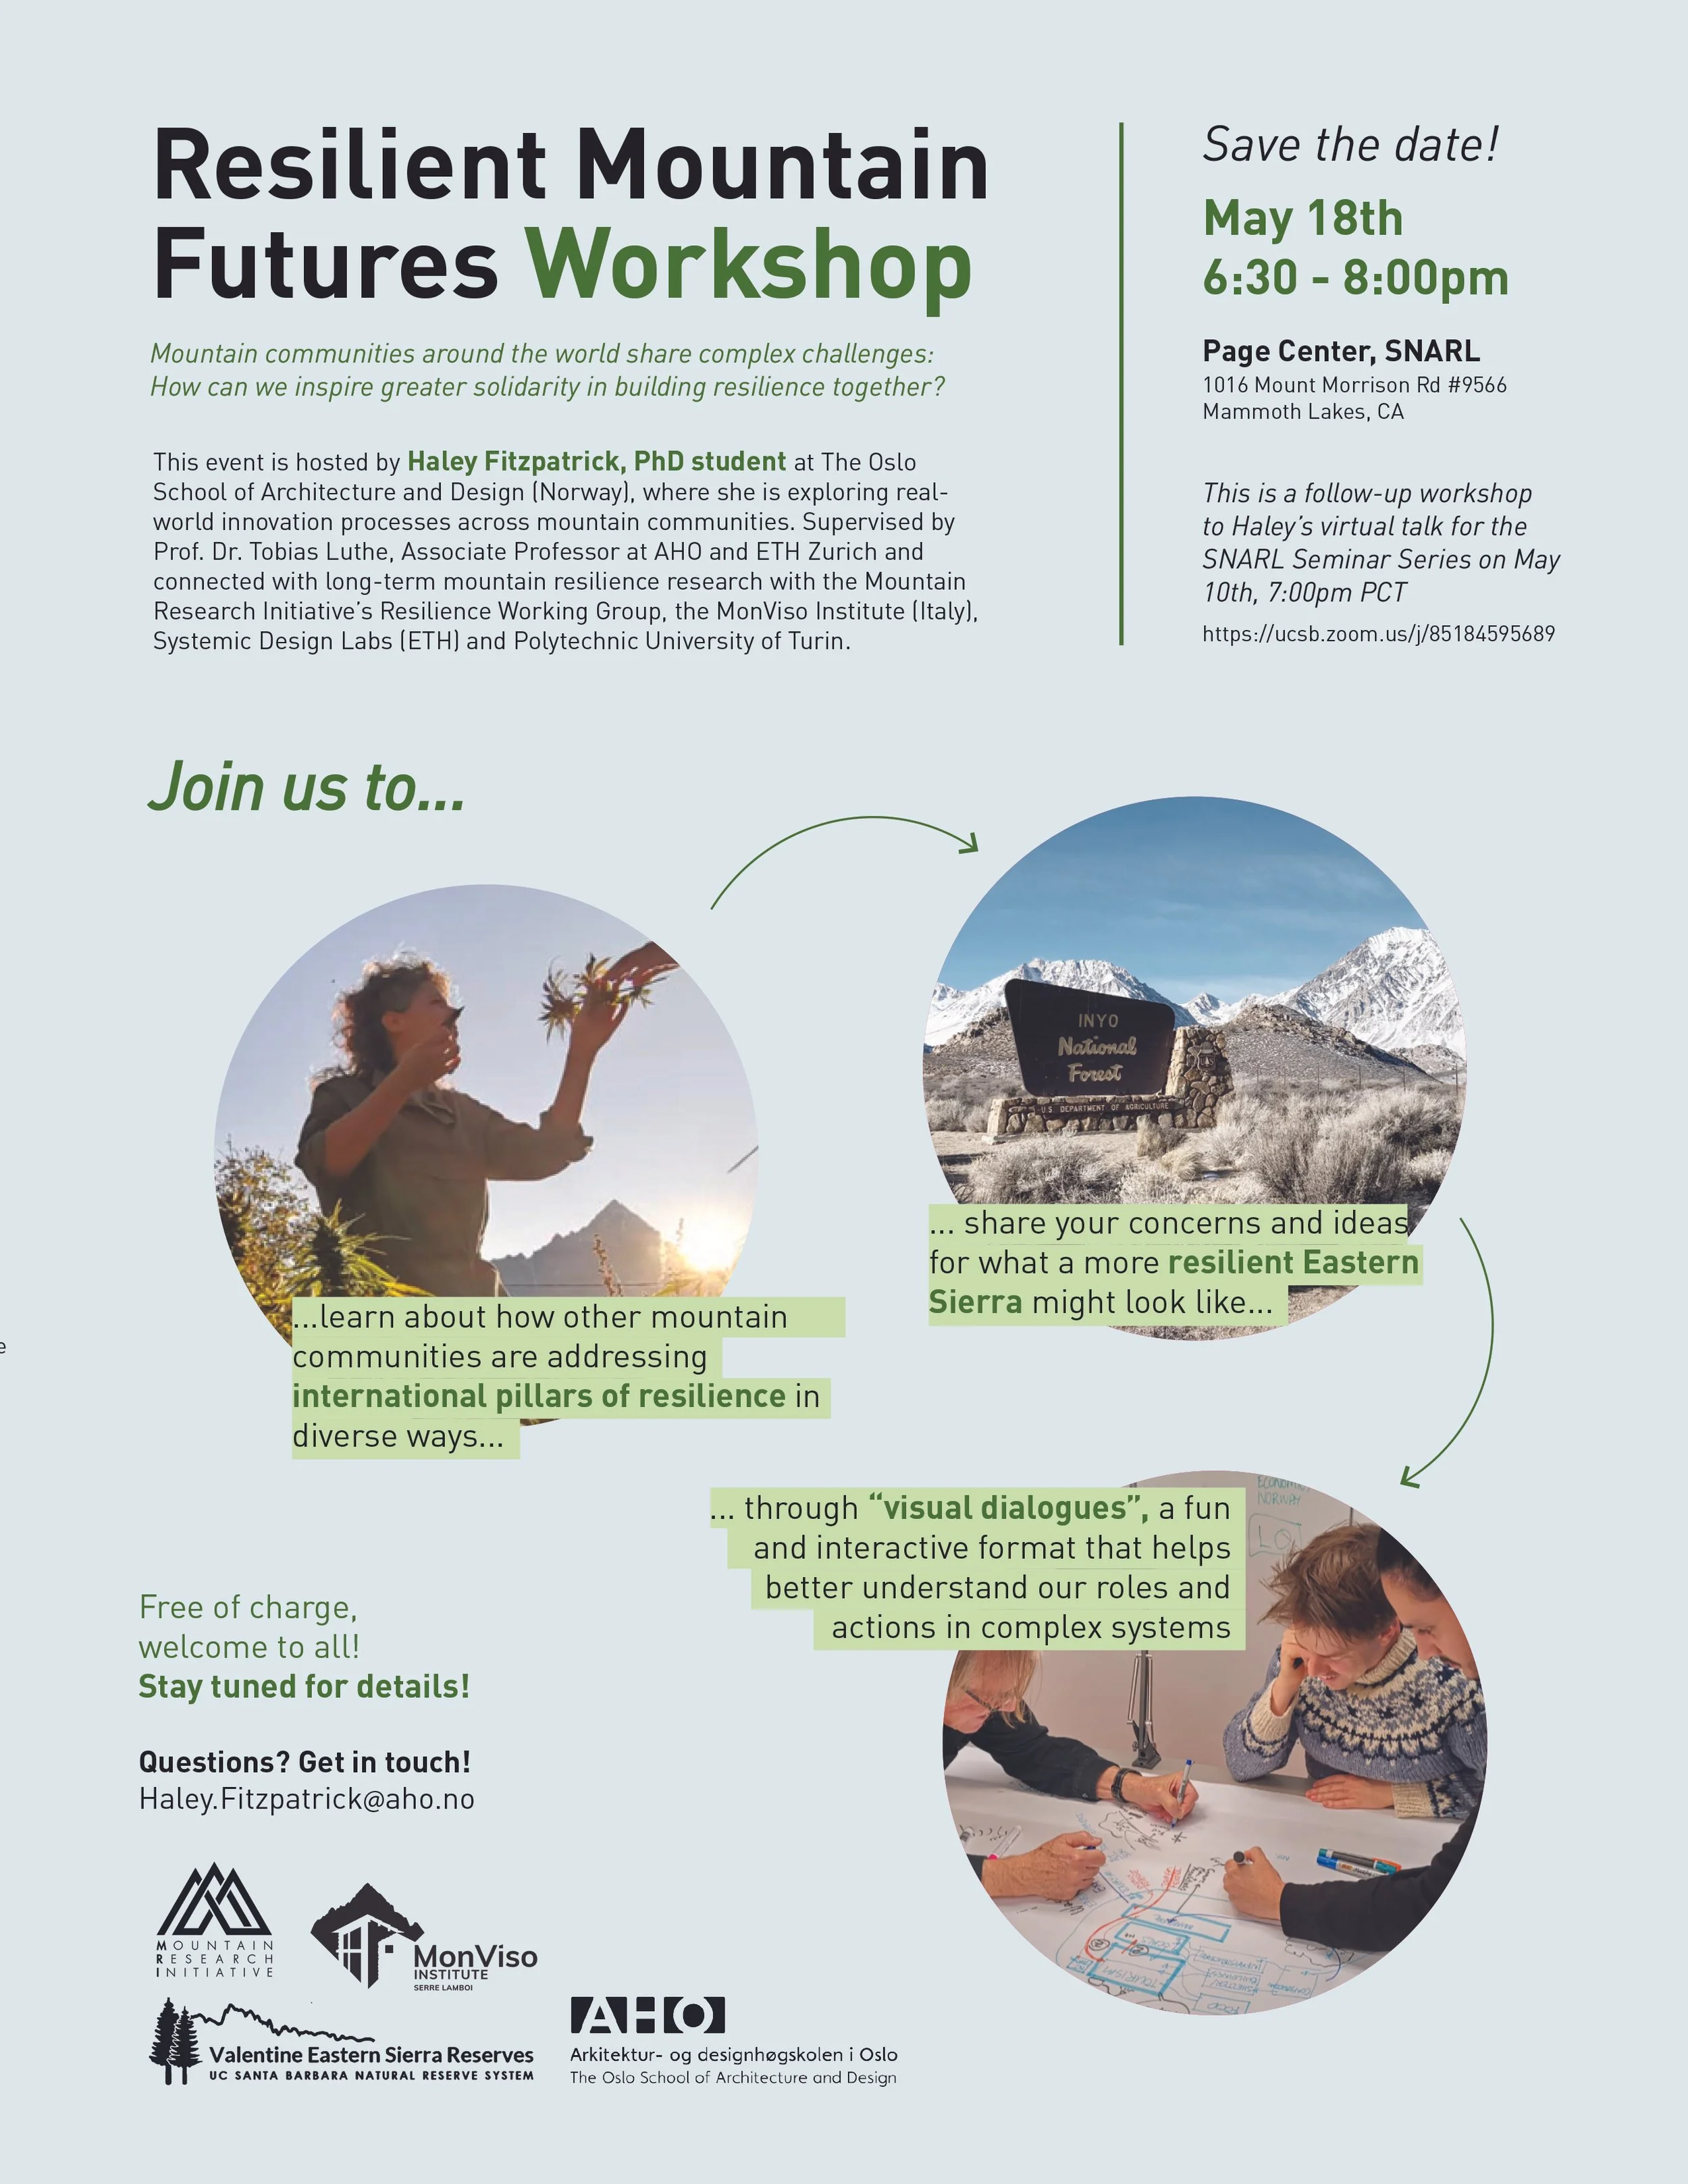
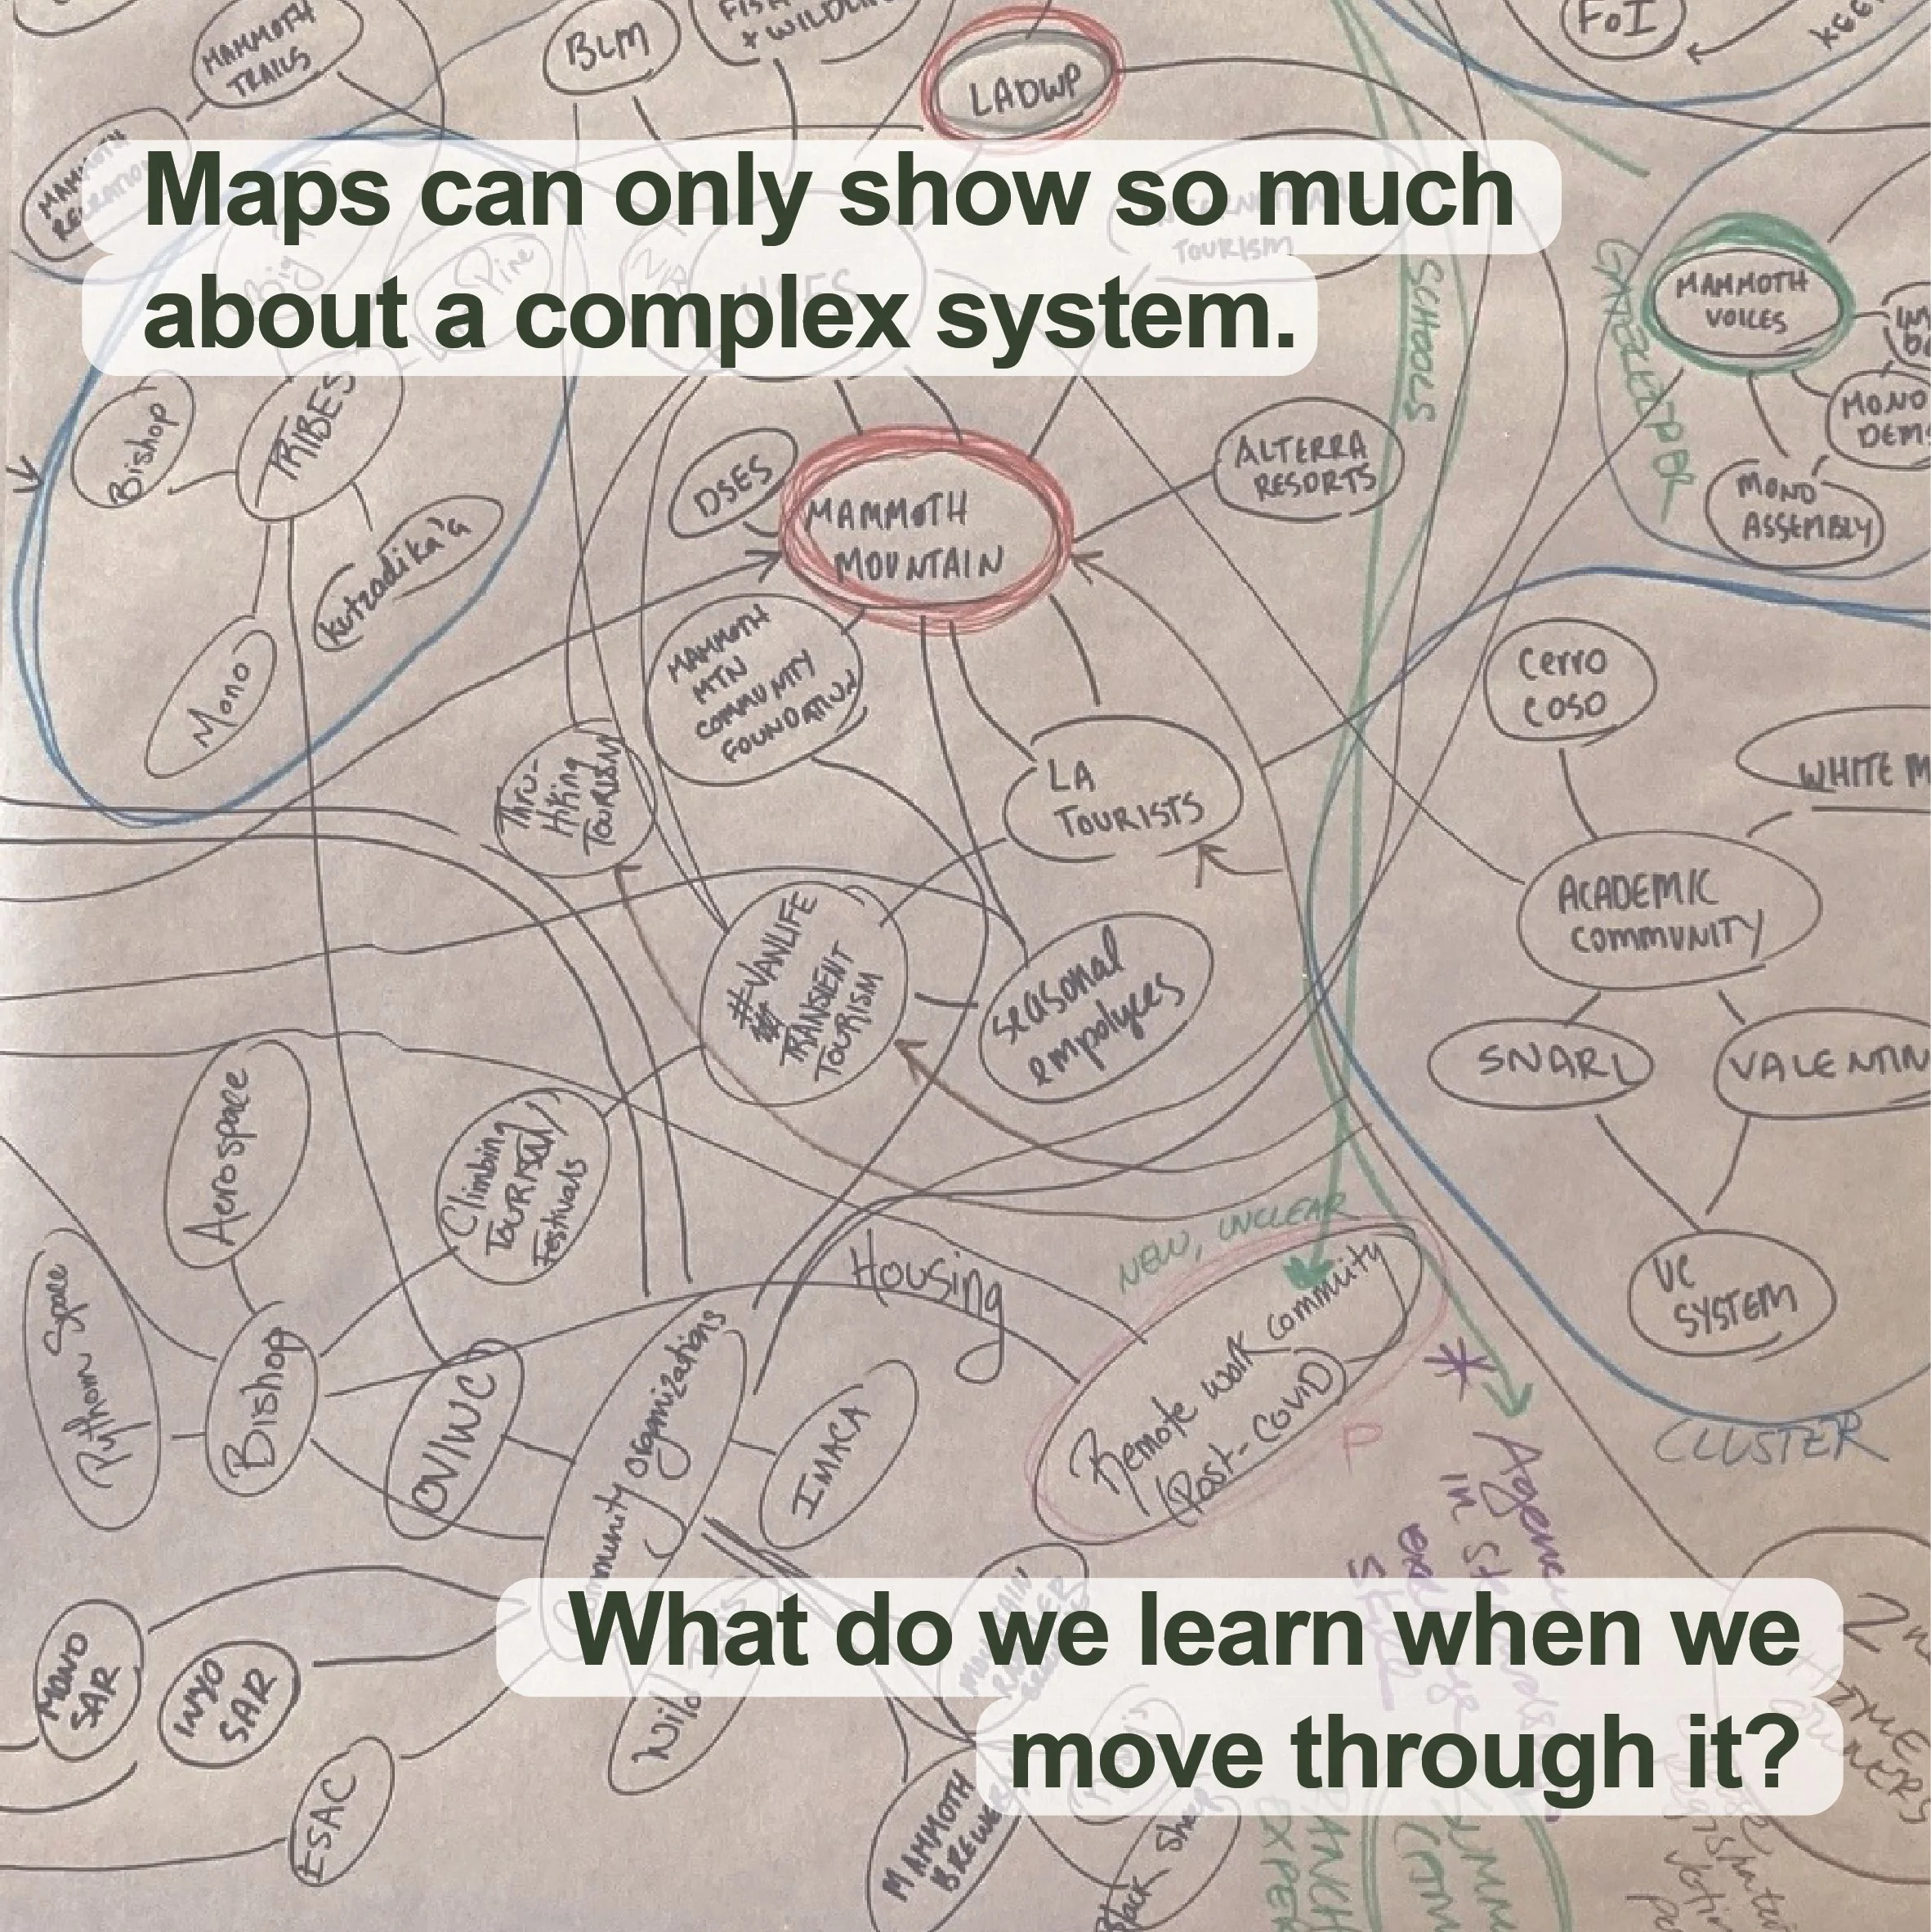
Flyer invitation to a visual mapping workshop series on the future of Mammoth Lakes in partnership with a local research center
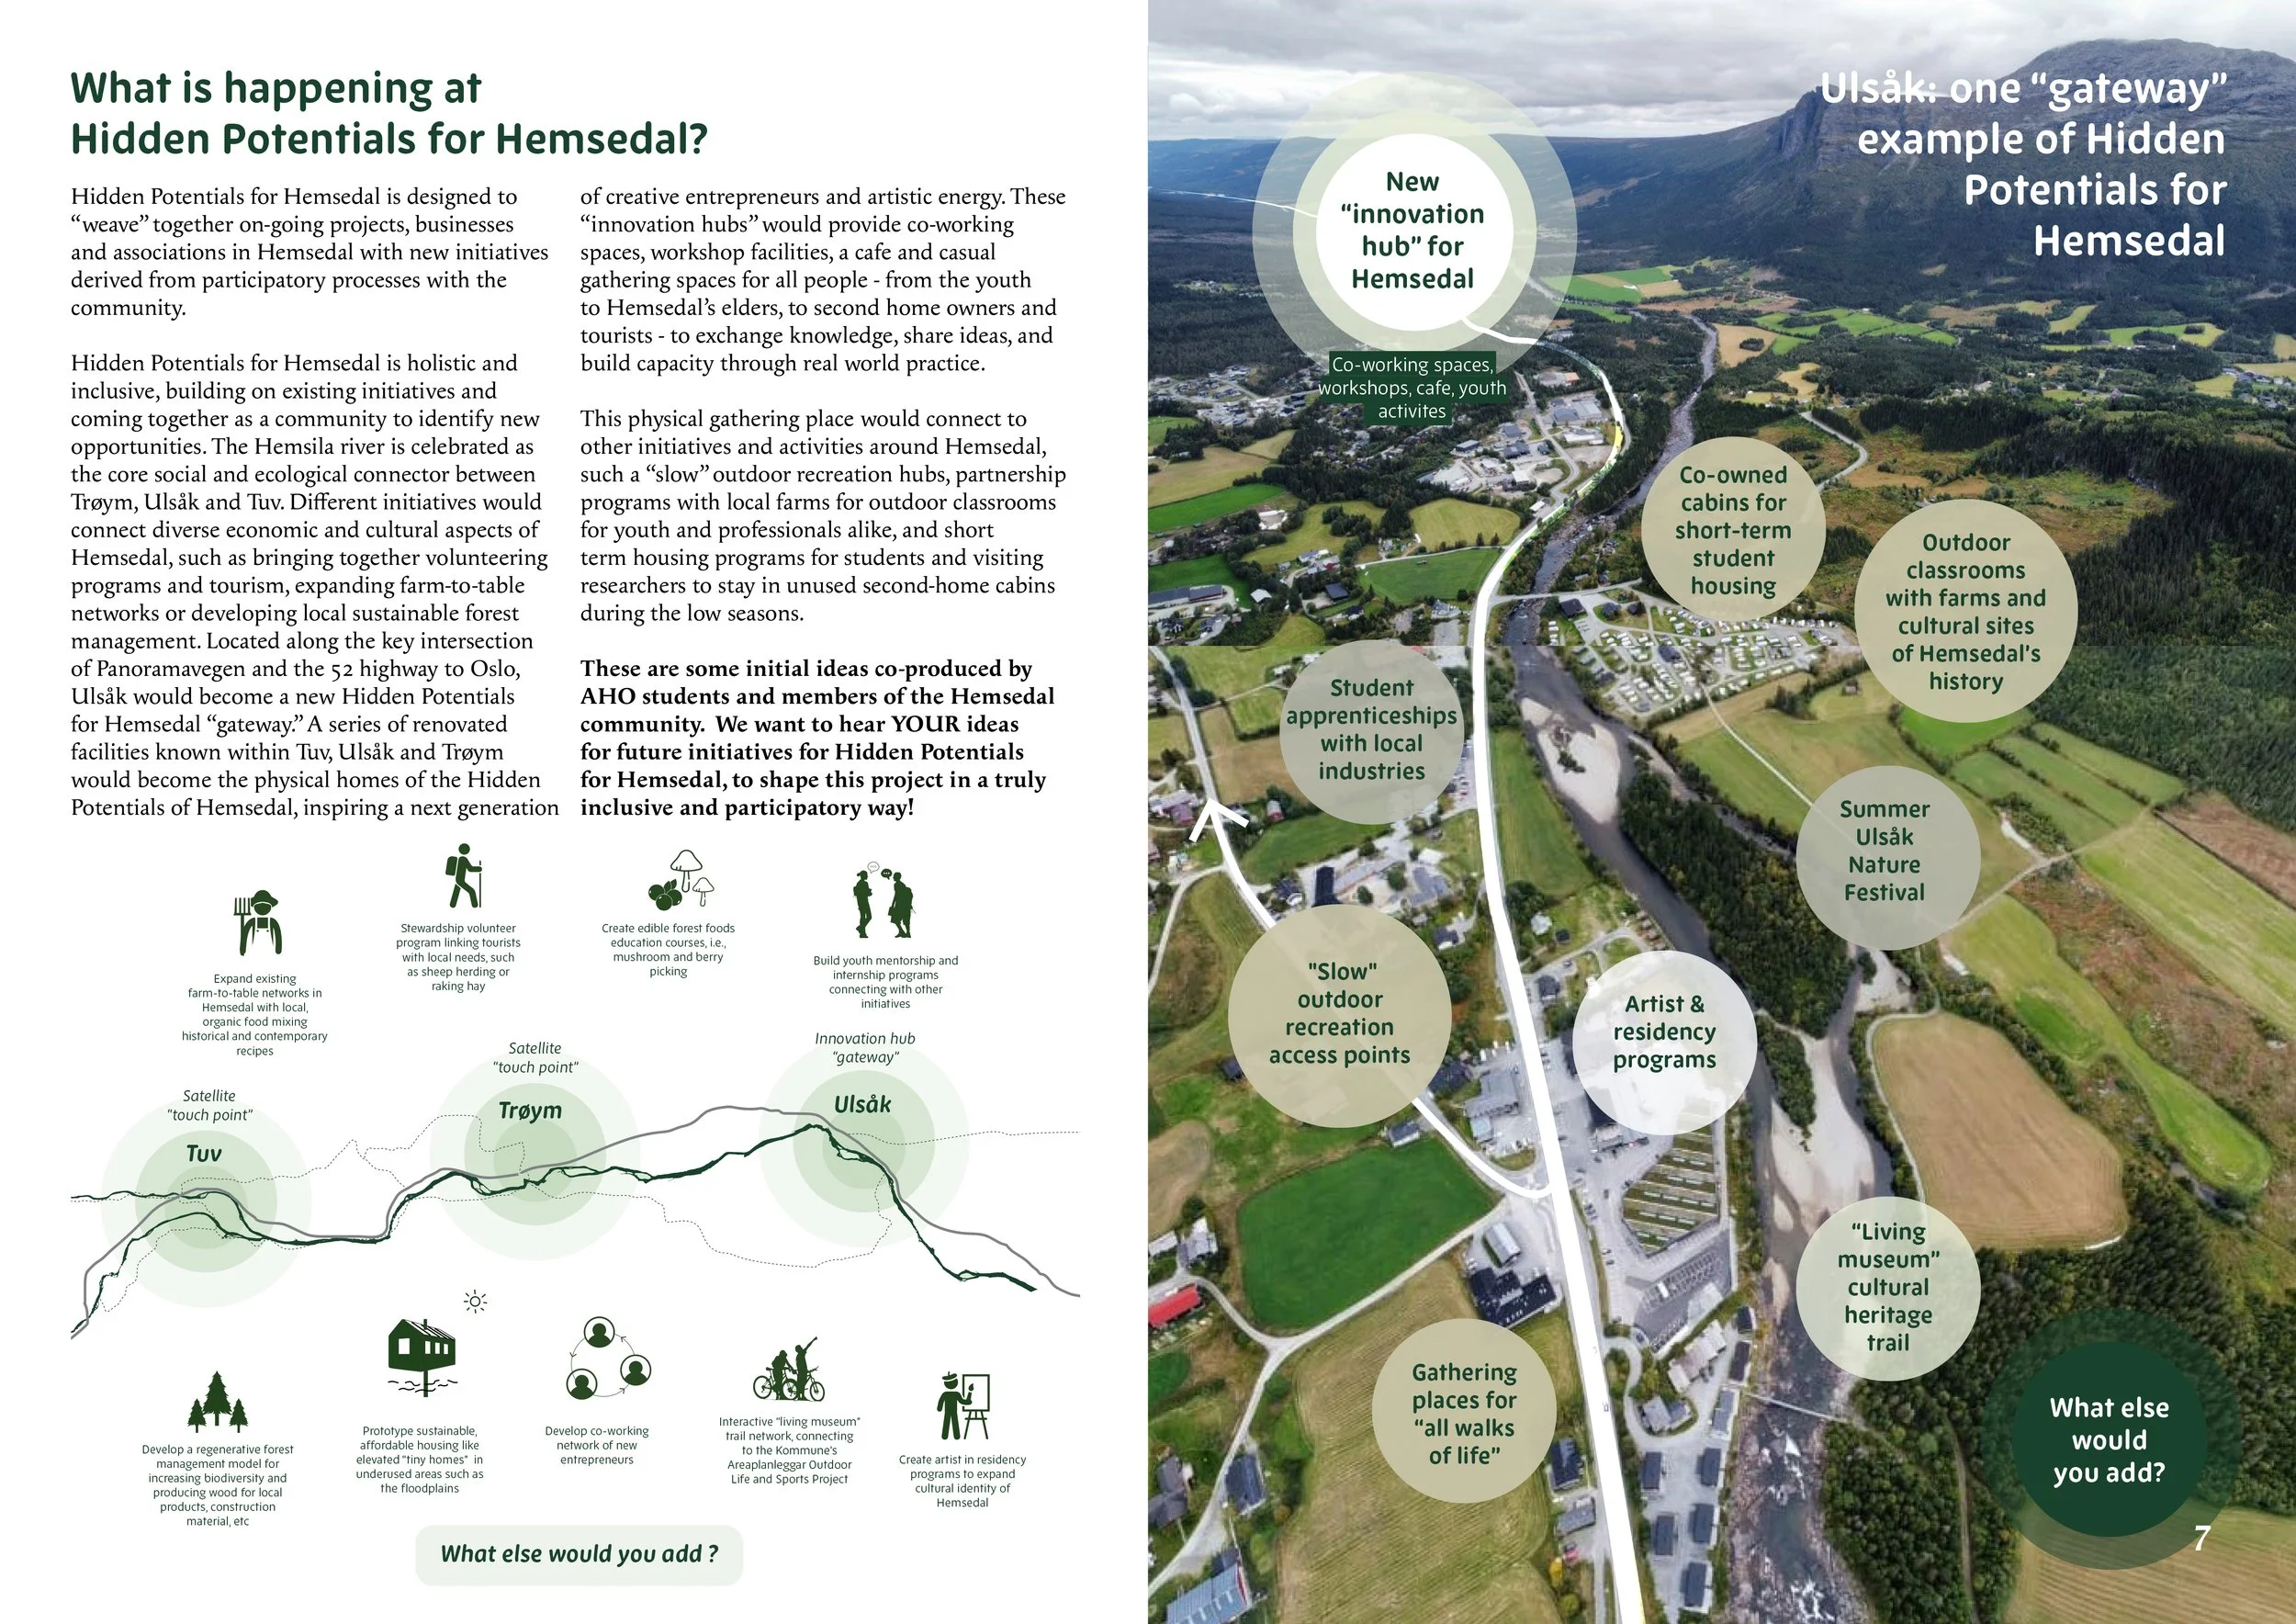
Promotional brochure developed to secure funding for a start-up initiative co-created by the Municipality of Hemsedal, local landowners, ETH Zurich, and The Oslo School of Architecture & Design
Social Media Content
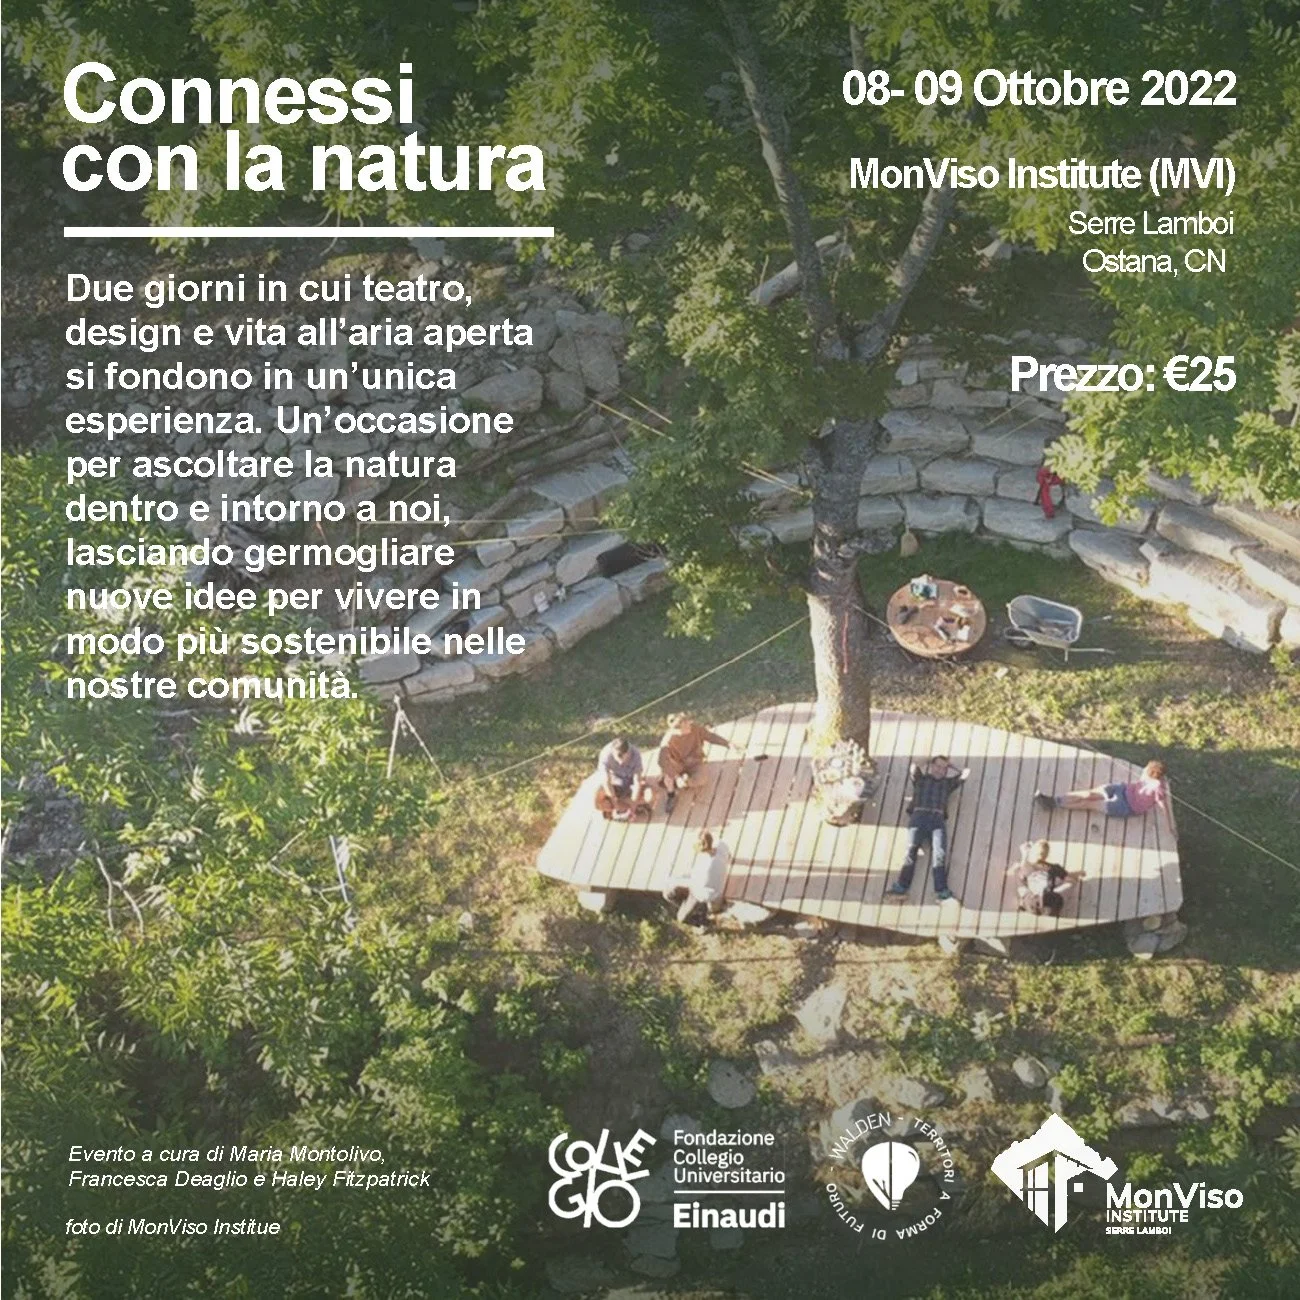
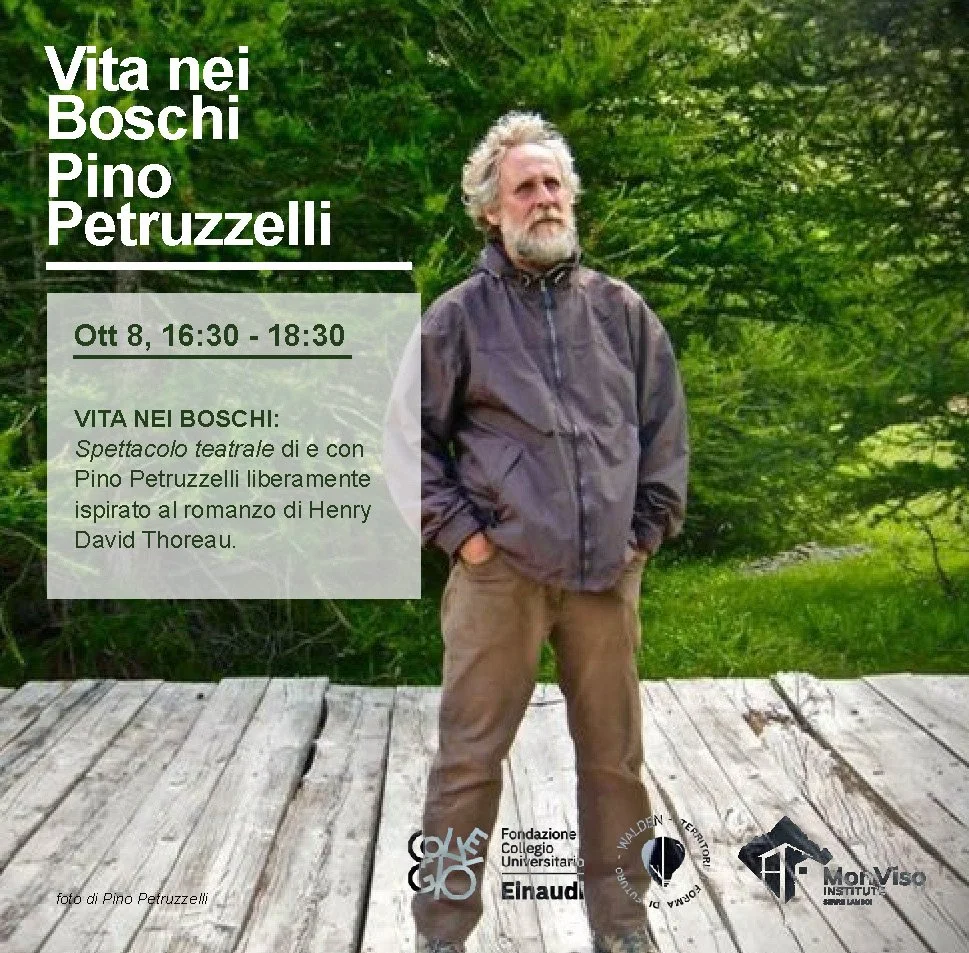
Social media campaign for an “Reconnecting with Nature” outdoor theater event hosted by the MonViso Institute in partnership with regional NGOs and academic institutions.


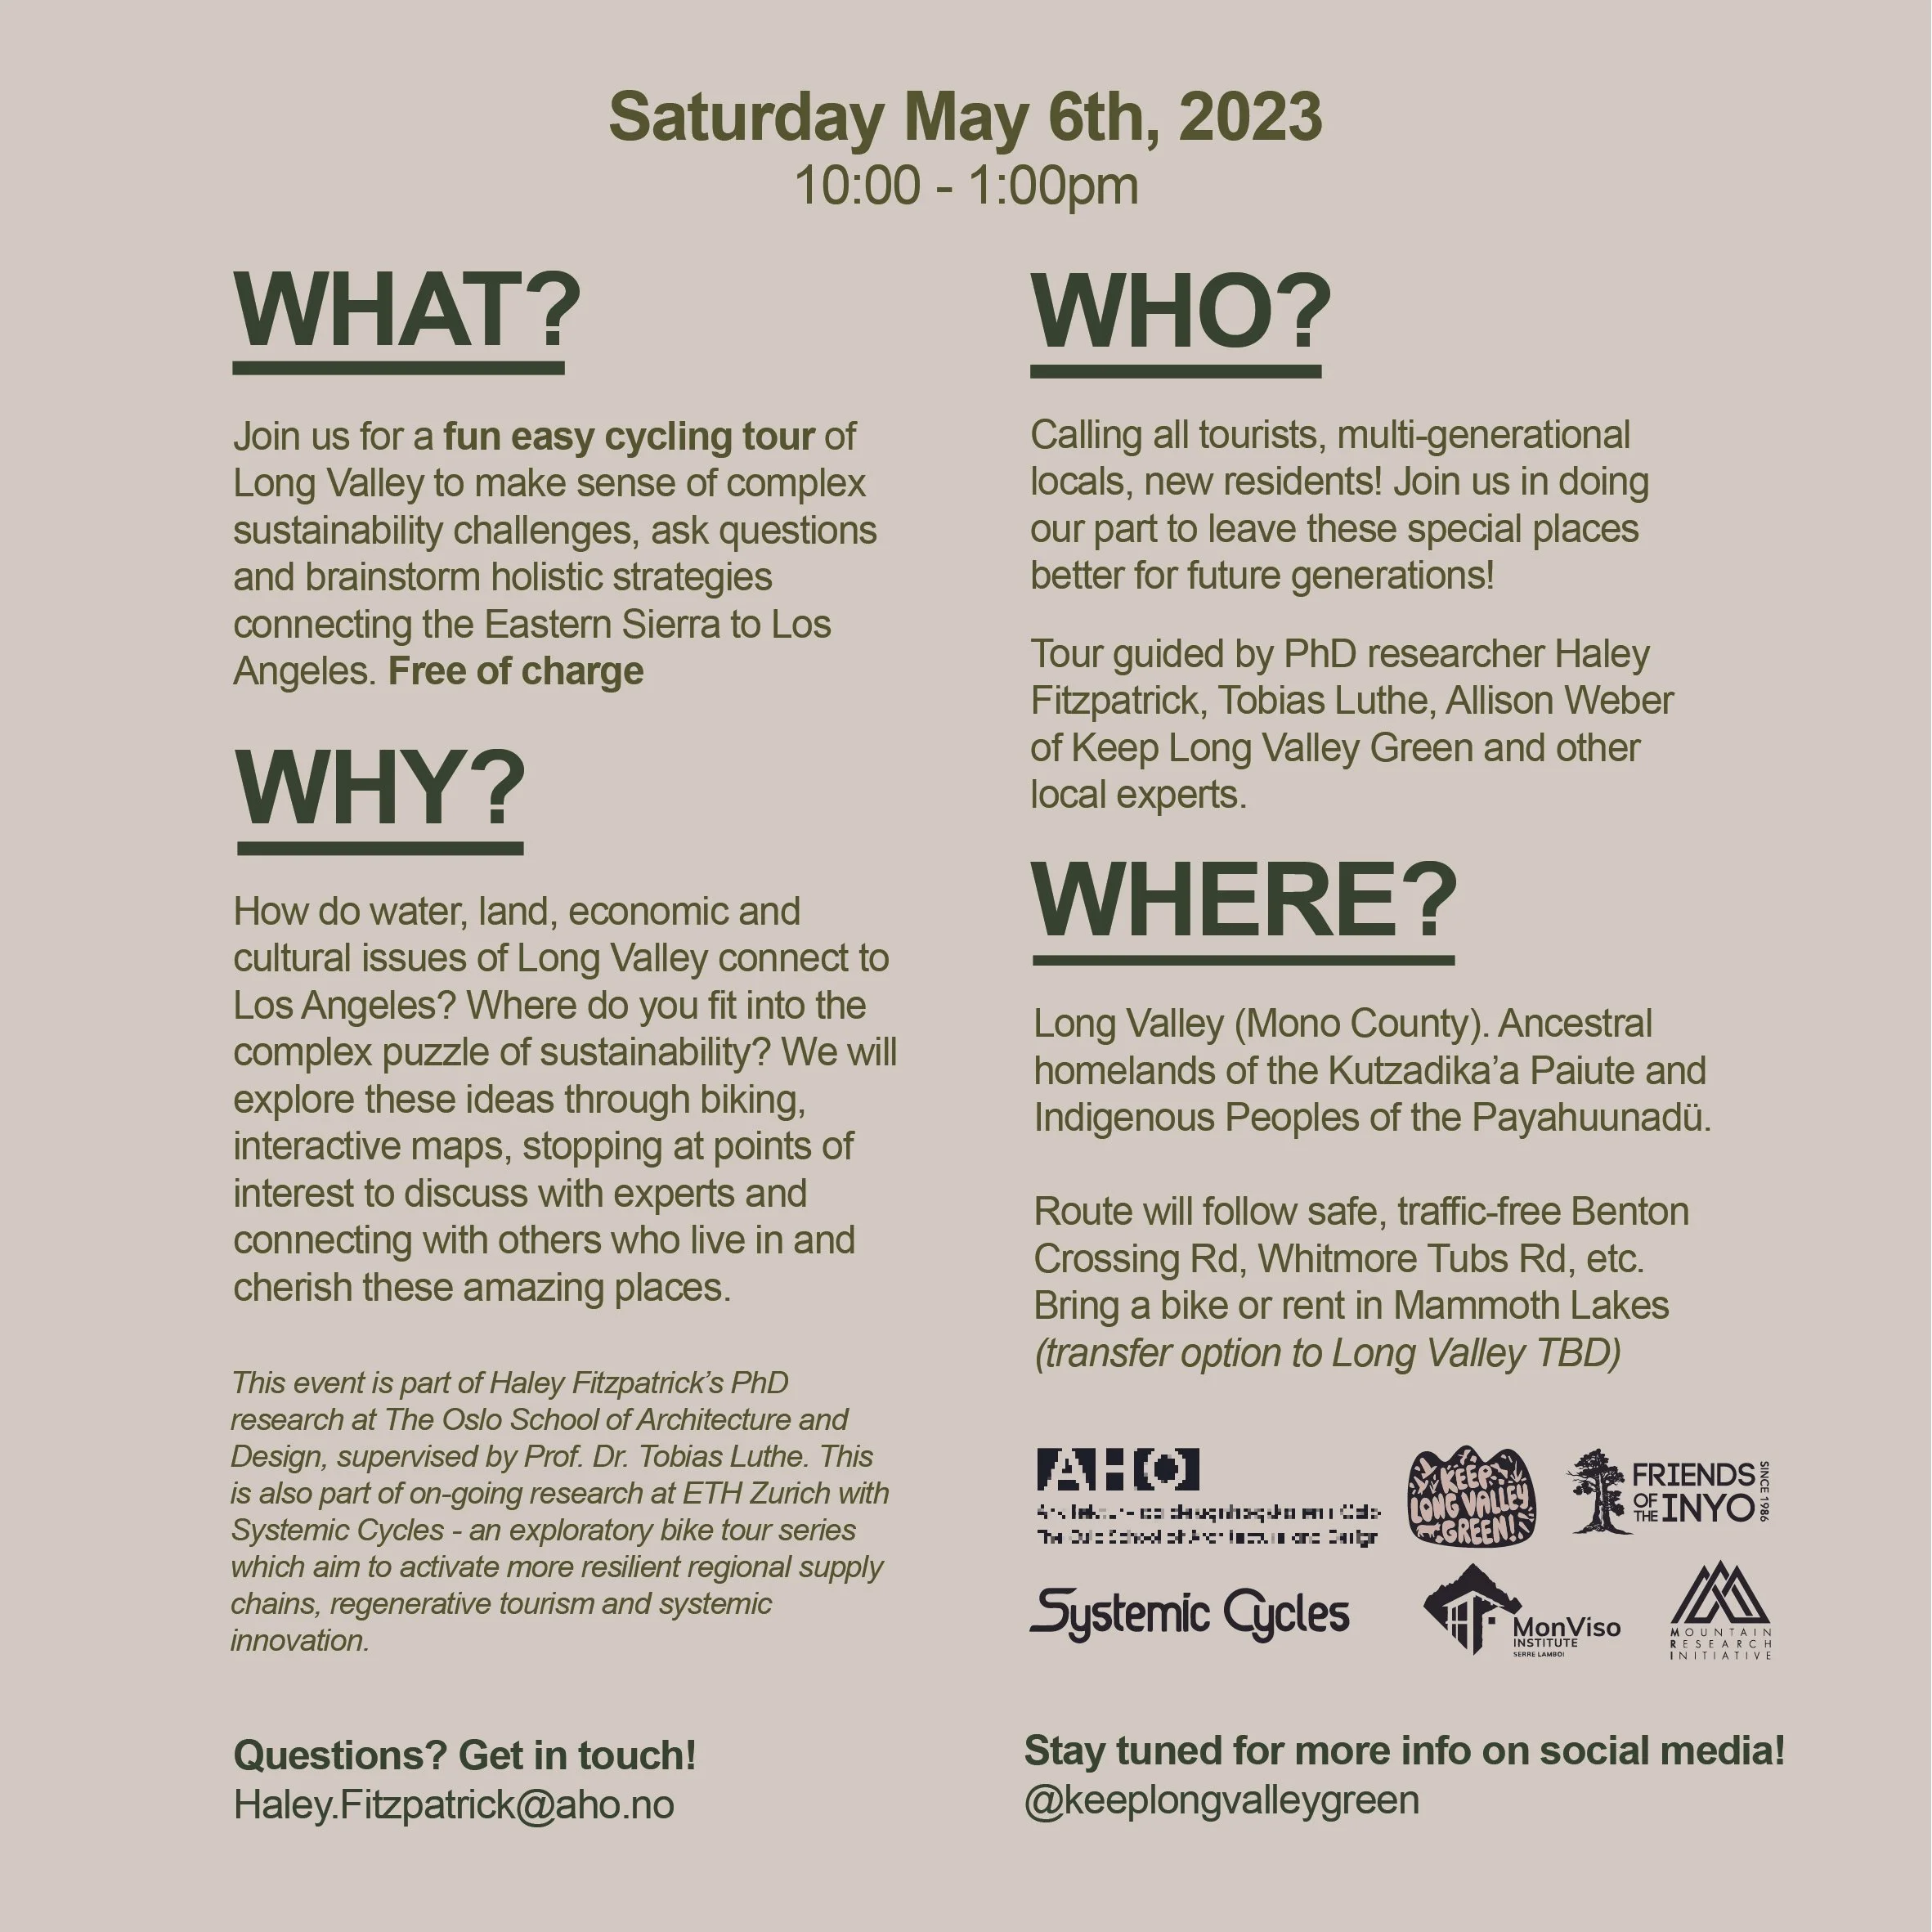
Social media campaign for an “Systemic Cycles” outdoor experiential learning event with Keep Long Valley Green in Mammoth Lakes, California.
Diagrams & Educational Didactics

Visualization from Fitzpatrick, 2023 showing how concepts such as complexity, resilience, and awareness emerge across diverse worldviews.
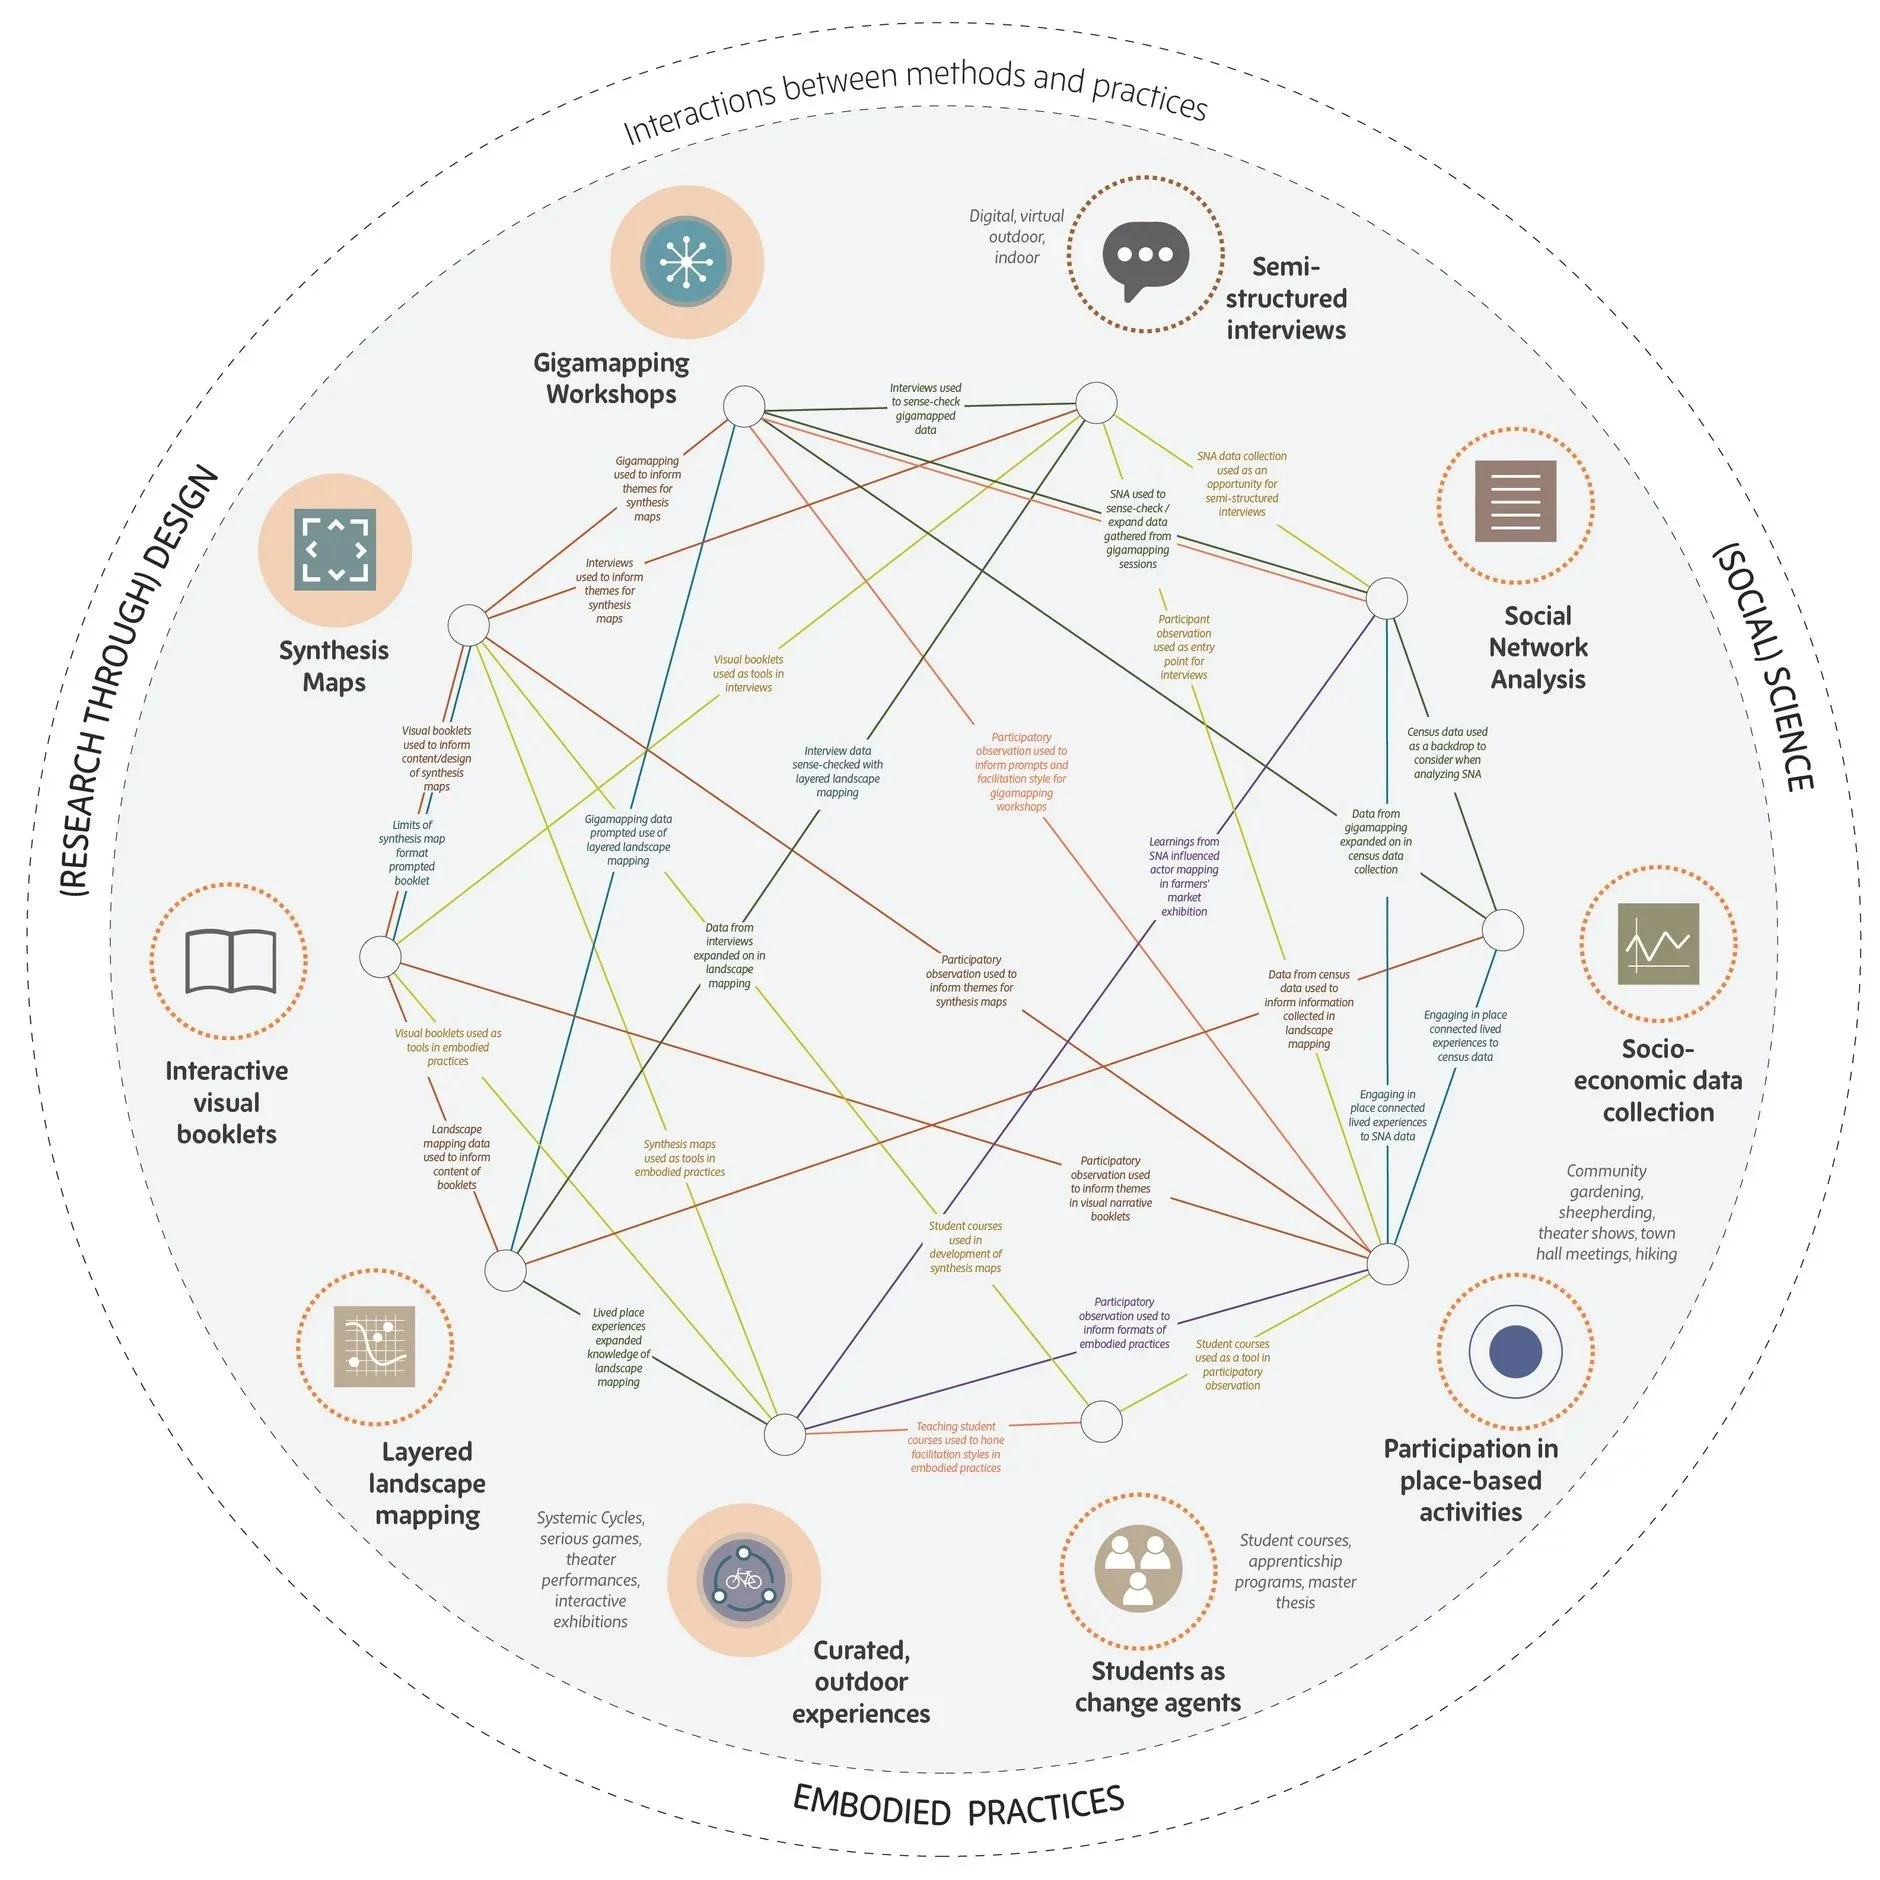
Diagram charting the dynamic interactions between different methods and practices from Fitzpatrick et al., 2024.

Visualizing the nested scales of regenerative design, from products to broader bioregions, inspired by the fractal geometry of the Fibonacci spiral. Co-developed with Tobias Luthe and Daniel Christian Wahl.

Diagram from Fitzpatrick et al., 2024 illustrating the interactions between different dimensions of reflexivity—methodological, data, interpersonal, contextual etc.

Visualizing how bioregionalism is shaped by the dynamic interplay between rural-urban contexts. Co-developed with Tobias Luthe.
System Maps
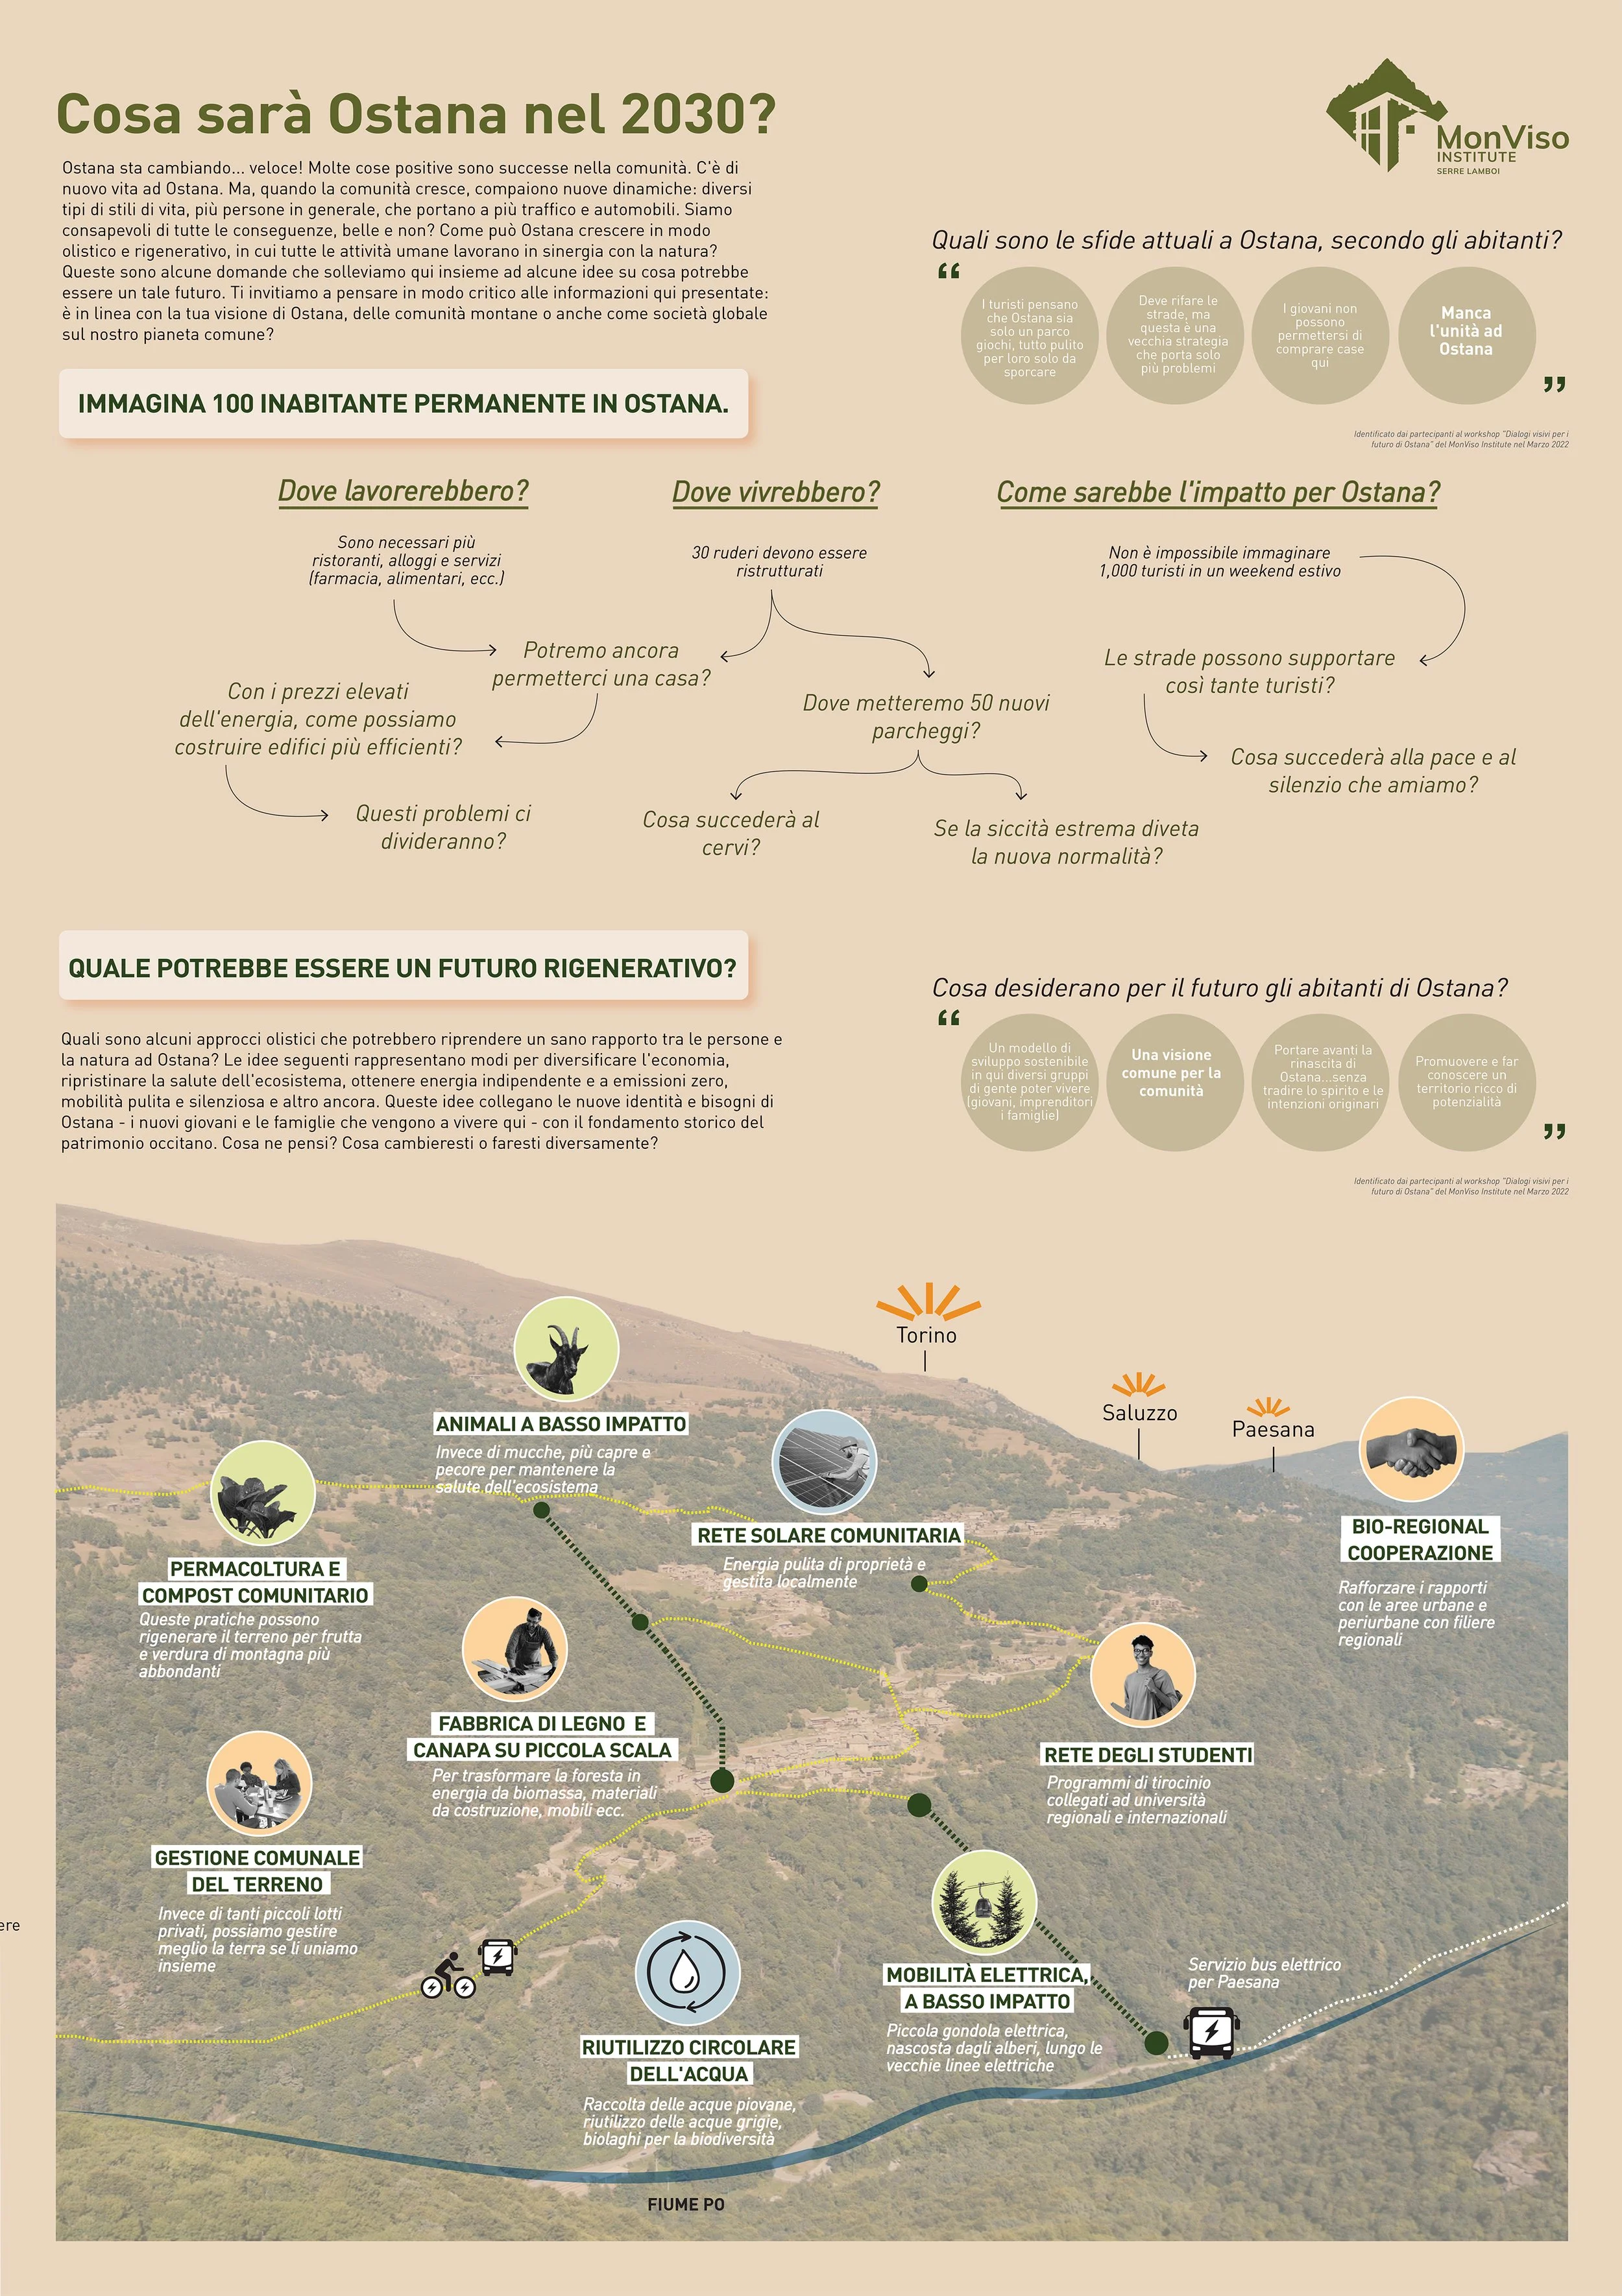
Synthesis maps presenting regenerative strategies for Ostana, ranging from communal composting centers to an internship program with a regional university. Co developed with Tobias Luthe, MVI interns and community members of Ostana.

Didactic tool synthesizing core aspects of social network analysis and network theory to support stakeholders in understanding how to work towards more resilient communities

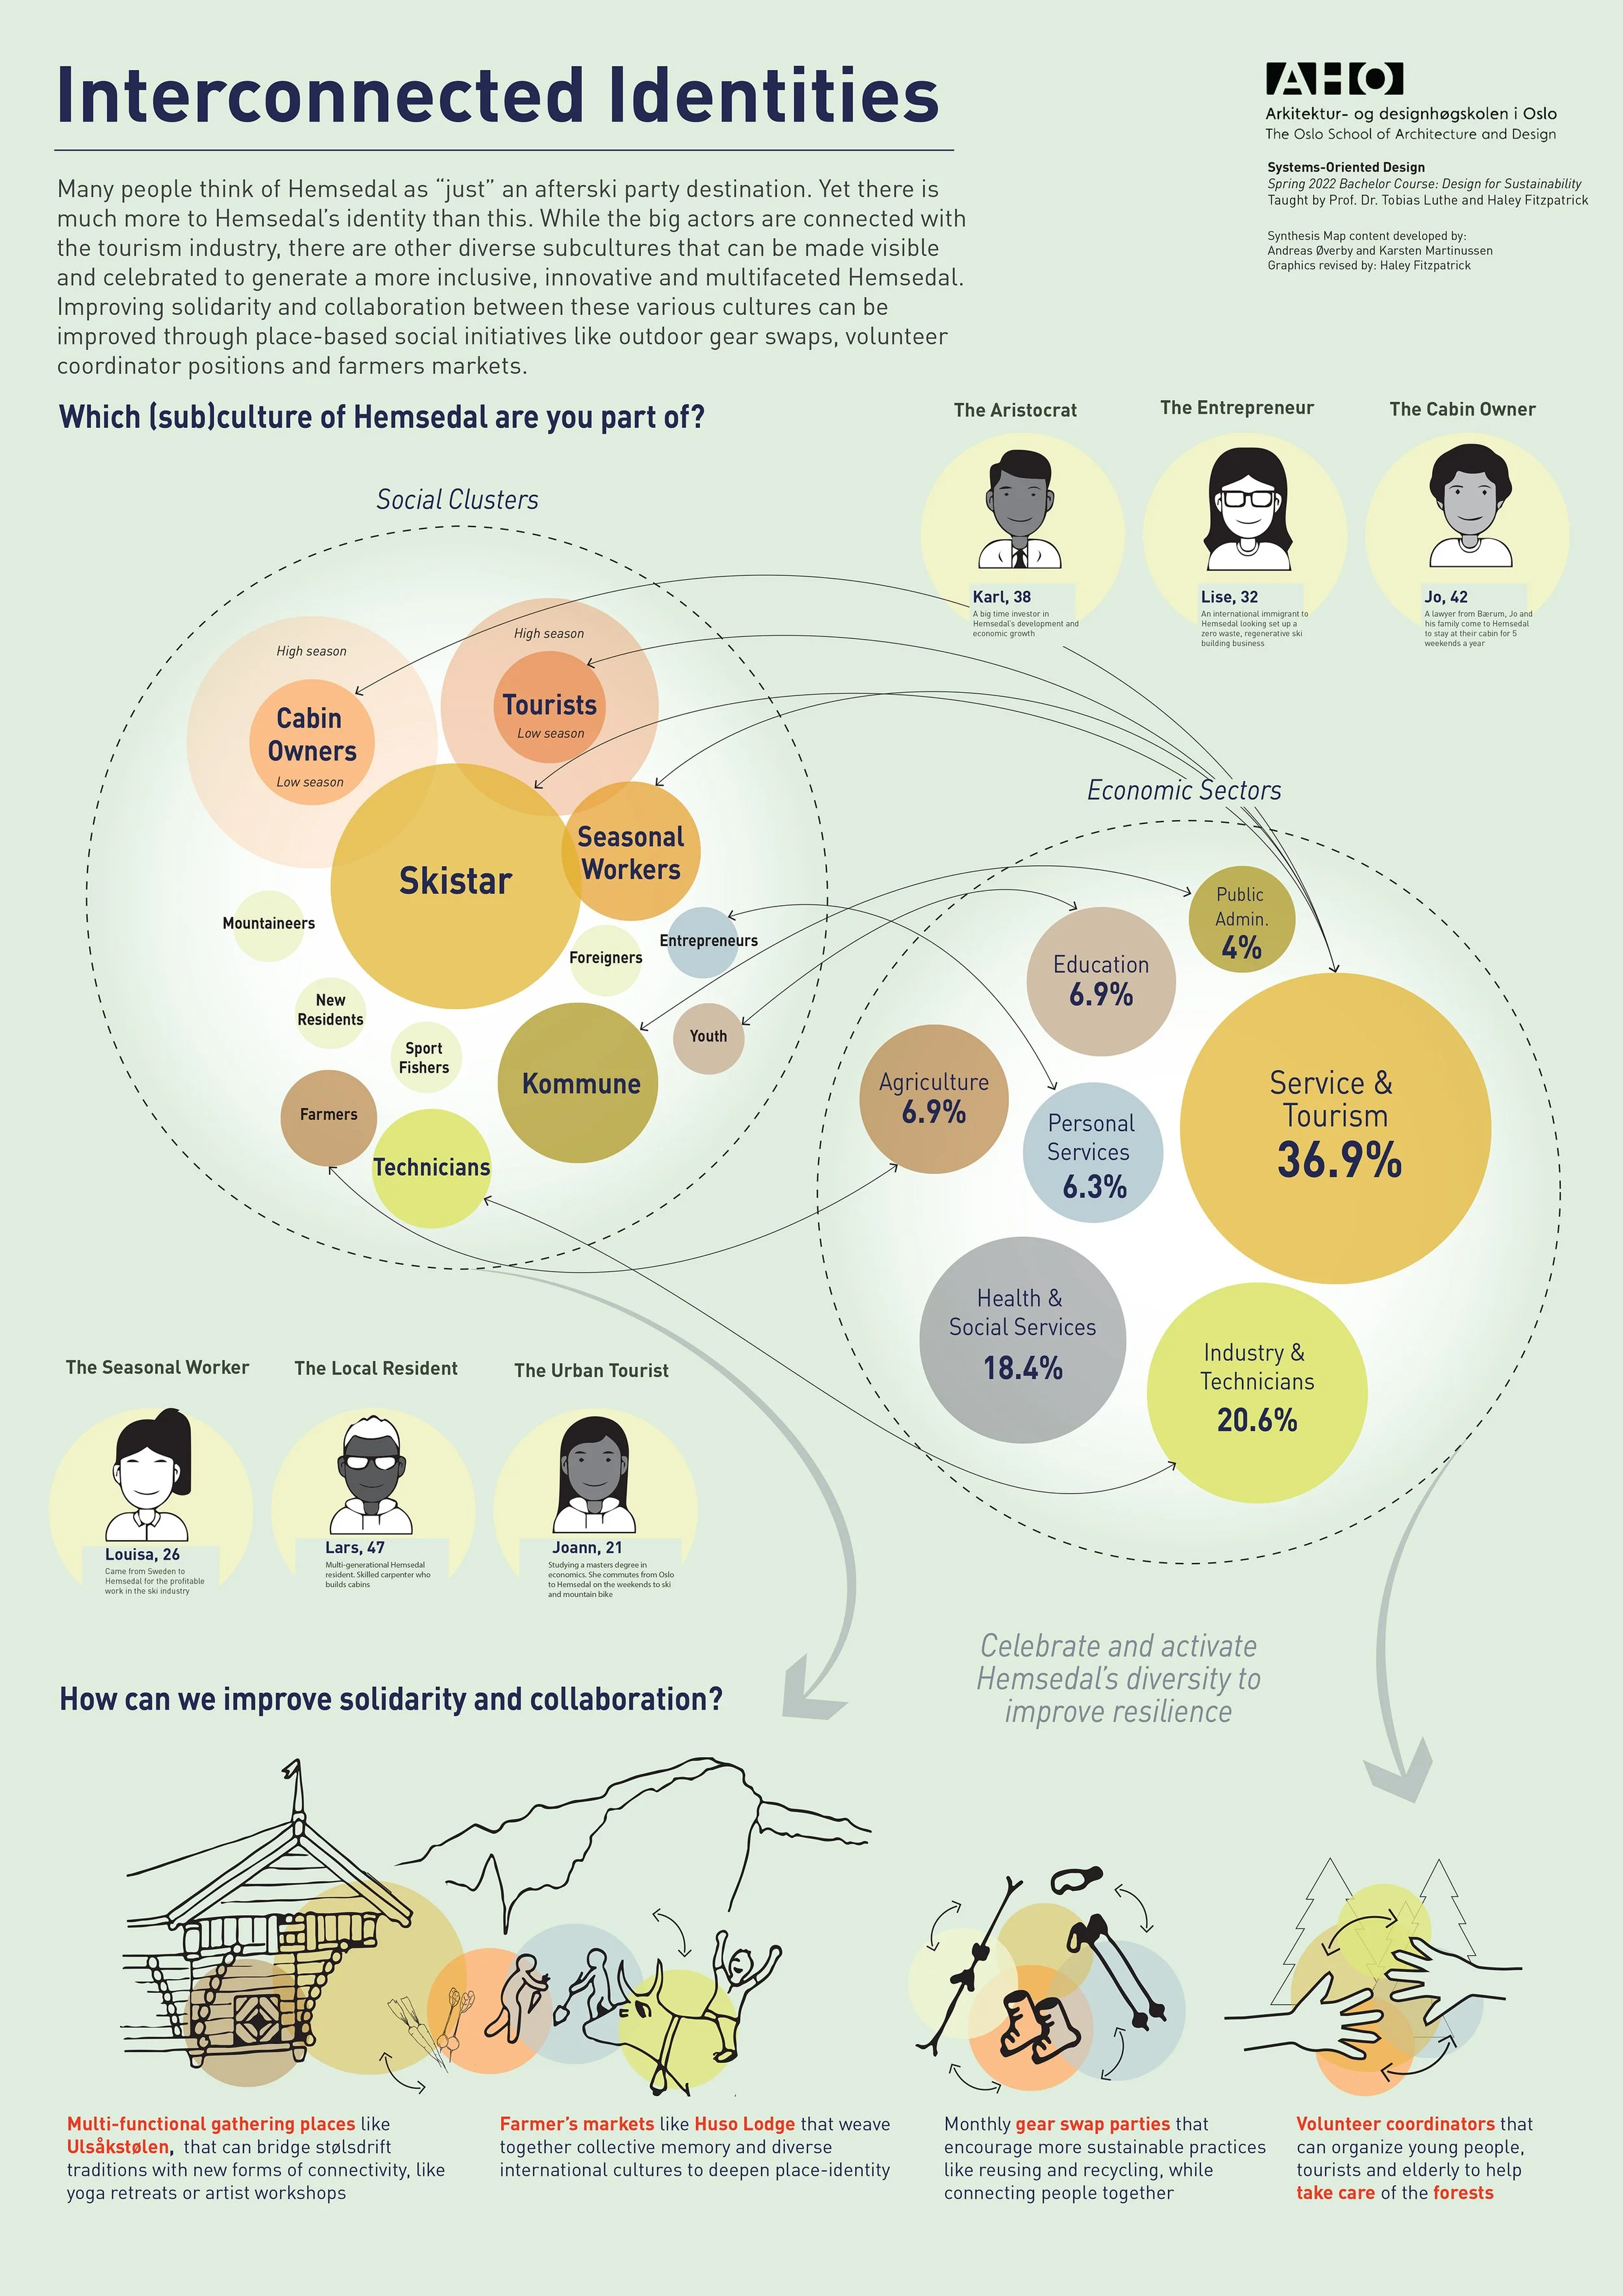
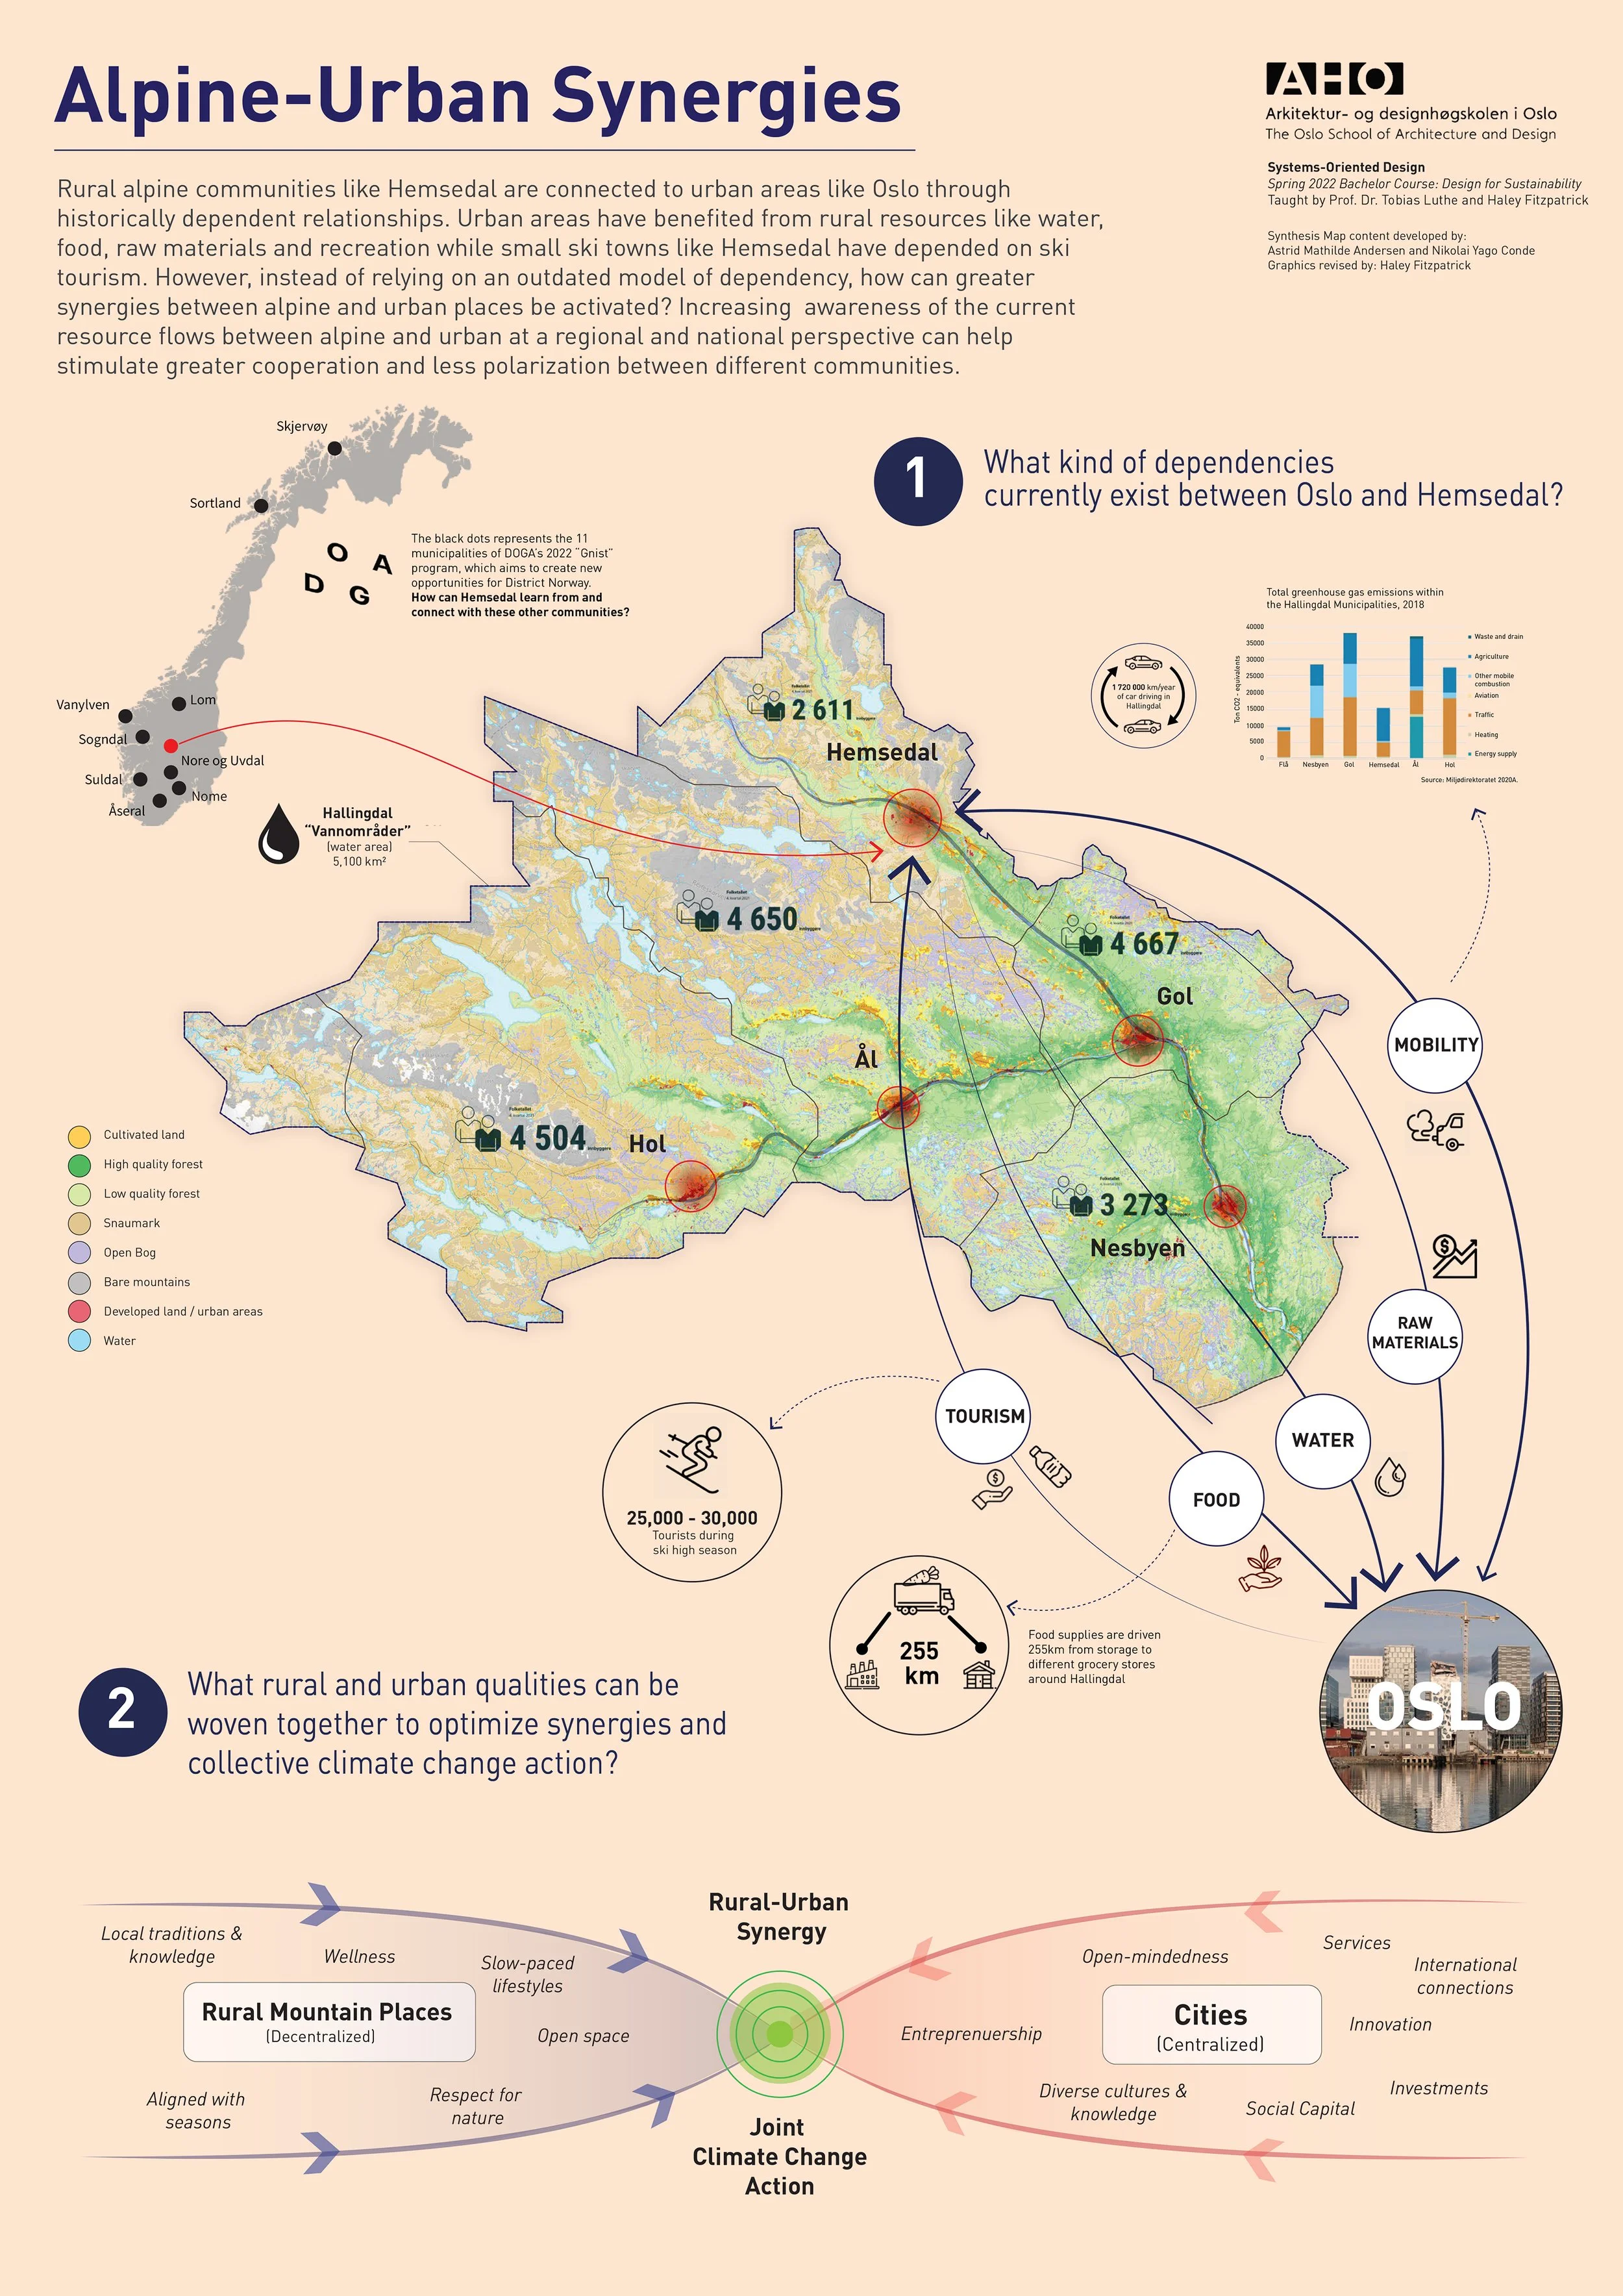
A series of synthesis maps showing a range of regenerative strategies co-developed with AHO students, Tobias Luthe and community members of Hemsedal.